Techno Barje

JSctypes Round Two

Jsctypes has been introduced in Firefox 3.6 with simple C function call and only simple types: int, char, string, … But the next iteration of jsctypes that is coming in Firefox 4 is going to allow full C binding, with support of C structures and the ability to define a javascript function and give it to C library as a function pointer.

No more compilation, no more mozilla sdk download, nor XPCOM stuff, just plain javascript and only a tiny part of function and datatype declaration before doing a native binding!

But let the code talk! Here is an example that display a tray icon on windows. You can copy and paste this code in your Javascript Console in Firefox 4 beta, just do not forget to change the icon path defined in the loadimage function call.

  /* simply load "ctypes" object */
  Components.utils.import("resource://gre/modules/ctypes.jsm");
  
  /* Load libraries that we are going to use */
  var libuser32 = ctypes.open("user32.dll");
  var libshell32 = ctypes.open("shell32.dll");

  /* Here is the tedious work of declaring functions arguments types and struct attributes types */
  /* In fact it's quite easy, you just have to find which precise type are using your native functions/struct */
  /* but it may be hard to known, for example in windows API, which precise type is behing their "HANDLE" type ... */
  /* I recommend you to find and look at python ctype binding source code because they already had done this work */
    
  /*
  HANDLE WINAPI LoadImage(
    __in_opt  HINSTANCE hinst,
    __in      LPCTSTR lpszName,
    __in      UINT uType,
    __in      int cxDesired,
    __in      int cyDesired,
    __in      UINT fuLoad
  );
  */
  var loadimage = libuser32.declare("LoadImageA",
    ctypes.stdcall_abi,
    ctypes.int,
    ctypes.int,
    ctypes.char.ptr,
    ctypes.int,
    ctypes.int,
    ctypes.int,
    ctypes.int);
  const LR_LOADFROMFILE = 16;
  const IMAGE_ICON = 1;
  
  var notificationdata = ctypes.StructType("NOTIFICATIONDATA",
                                [{ cbSize  : ctypes.int          },
                                 { hWnd    : ctypes.int          },
                                 { uID     : ctypes.int          },
                                 { uFlags  : ctypes.int          },
                                 { uCallbackMessage : ctypes.int },
                                 { hIcon        : ctypes.int     },
                                 { szTip        : ctypes.char.array(64) },
                                 { dwState      : ctypes.int     },
                                 { dwStateMask  : ctypes.int     },
                                 { szInfo       : ctypes.char.array(256) },
                                 { uTimeoutOrVersion : ctypes.int },
                                 { szInfoTitle  : ctypes.char.array(64) },
                                 { dwInfoFlags  : ctypes.int },
                                 { guidItem     : ctypes.int },
                                 { hBalloonIcon : ctypes.int }
                                ]);
  const NIF_ICON = 0x00000002;
  
  /*
  BOOL Shell_NotifyIcon(
    __in  DWORD dwMessage,
    __in  PNOTIFYICONDATA lpdata
  );
  */
  var notifyicon = libshell32.declare("Shell_NotifyIcon",
                                    ctypes.stdcall_abi,
                                    ctypes.bool,
                                    ctypes.int,
                                    notificationdata.ptr);
  const NIM_ADD = 0x00000000;
  

  /* And now, the "real" code that is calling C functions */

  /* load our ico file */
  var hIcon = loadimage(0, "c:\\default.ico", IMAGE_ICON, 16, 16, LR_LOADFROMFILE);
  
  /* create a C struct that is defining a notification in tray */
  var icon = notificationdata();
  icon.cbSize = notificationdata.size;
  icon.uFlags = NIF_ICON;
  icon.szTip = "My Tray Icon";
  icon.hIcon = hIcon;
  
  /* Display this notification! */
  notifyicon(NIM_ADD, icon.address());

We will be able to go futher and define a function callback to handle click events on the trayicon, but there is currently a bug which cause some crashes when using ctypes.FunctionType on windows. (ctypes.FunctionType allow to transform a custom Javascript function to a C function pointer)
Here is related bugs, which are still in process:

The first leads to crashes with FunctionType, and the second may lead to lib.declare with unfindable symbols errors when using ctypes.stdcall_abi.

Freemonkeys

Freemonkeys

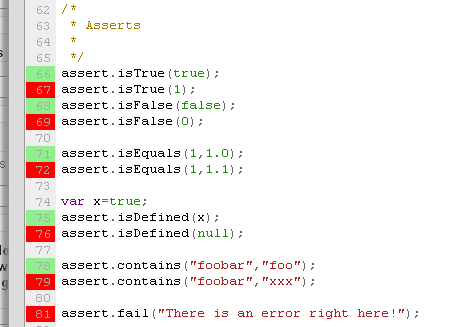
Yet another mozilla powered project! This time, a graphical unit tests editor/executer which enables you to spellcast an army of monkeys always happy to work hard on your projects and find bugs for free! asserts.png
Here is what they can do:

  • Launch any Mozilla application: Firefox, Thunderbird and any xulrunner app,
  • Use an empty profile for each test execution, or an existing one,
  • Speak fluently "assert" language: isTrue, isFalse, isDefined, equals, … etc,
  • Report you in real time test execution directly in your test source code,
  • They are always ready to work. You don’t need to restart Freemonkeys on each test execution, nor on your application reboot. Freemonkeys is an independant xulrunner app, which launch yours and then controls it remotly with a network connexion,
  • Spot easily any window, any tab and any DOM element with usefull distinctive parameters: XPath, windows attributes, zIndex order, … etc,
  • Offer a way to facilitate node identification by simply clicking on it, and seeing in real time what are selected node parameters,
  • They are able to write down some debug messages, inspect javascript objects with DOM Inspector, take screenshots of any elements,
  • Ease you some kind of tests, by providing you a simple HTTP webserver in order to simulate some websites answers,
  • They are not narrow-minded to synchronous tests but offers an assert library and some usefull API embracing asynchronous execution of your code!

Now let’s highlight some of these cool features …


Node selection

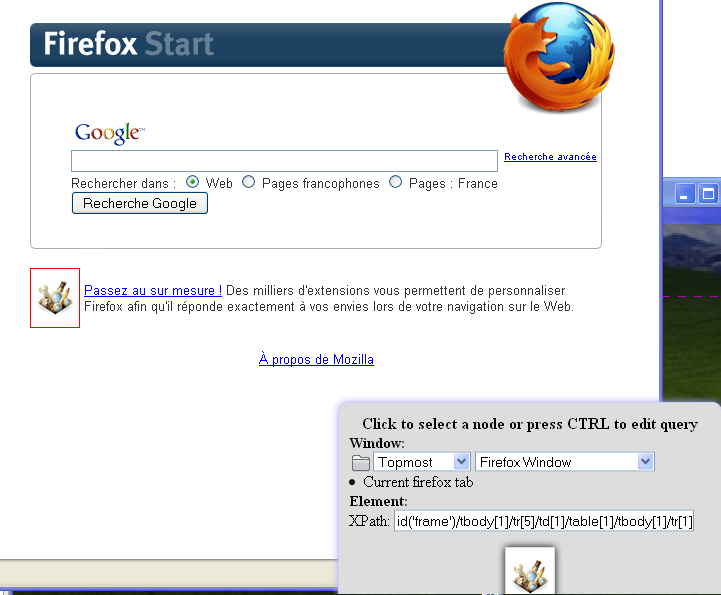
Here I was overing the tip of the day image. Freemonkeys spot it by highlighting it in red and show me all parameters which are going to be used to find this node later:
inspector.png You just have to click on it to get back to test editor and have all javascript code needed to get a reference to this node, something like this:

var top = windows.getRegistered("firefox-window", "topmost");
var tab = top.tabs.current;
var element = elements.xpath(tab, "id('frame')/tbody[1]/tr[5]/td[1]/table[1]/tbody[1]/tr[1]/td[1]/table[1]/tbody[1]/tr[1]/td[1]/img[1]");


Elements screenshots


Simply write:

element.screenshot();

And get a screenshot directly in the test editor:
element.screenshot.png


Live test execution reporting


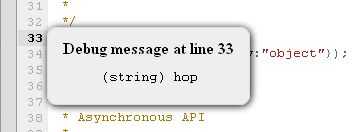
Your monkeys report each assert status in the test editor, allowing you to keep the focus on test writing and not losing time by switching from your app to your terminal, then to your code editor, your terminal and your app … etc, etc. asserts.png debug-msg.png


HTTP API


// Get a reference to a firefox tab
var top = windows.getRegistered("firefox-window", "topmost");
var tab = top.tabs.current;

// Start an HTTP server on port 81
http.start("81");

// A successfull test
// Create an assert objet which is going to wait for a request on root path of our http server
var test = http.assertGetRequest("/");
// Open this page in the tab
tab.open("http://localhost:81/");
// Now wait for this request
test.wait();

// The same test but with a non-existant page on our local server, so a failing test!
var test = http.assertGetRequest("/");
tab.open("http://localhost:81/foo");
test.wait();


Asynchronous tests


// A usefull function which allow you to block test execution for an amount of time in ms
wait.during(1000);

// The simpliest asynchronous test
wait.forTrue(function () {
  return true;
});

// Another, which is going to pass after 3s, with this setTimeout
var v=true;
wait.setTimeout(function() {
  v=false;
},3000);
wait.forFalse(function () {
  return v;
});

// Finally, a test which will pass when the test function is going to be called ten times
// (wait for the anonymous function returns 10)
var i=0;
wait.forEquals(function () {
  return i++;;
}, 10);


How to get it ?

Source code is available on github: http://github.com/ochameau/freemonkeys (LGPL licence)
If you are on windows:

And for linux and mac:

  • Download this one: freemonkeys-0.1.zip
  • Extract it somewhere
  • If you don’t have xulrunner, download it from here
  • Finally, launch Freemonkeys with this command:
    /path/to/your/xulrunner/dir/xulrunner /path/to/freemonkeys/application.ini
    

Session Per Tab in Firefox

The brand new version of Yoono, Yoono7 brings a long-awaited Firefox feature: the possibility to sign-in on the same website with multiple accounts in different tabs or windows.


Althought this new feature is a big technical challenge, for the end user, it’s really simple and non-intrusive! This feature only add one simple "profile" selector on the left of the URL bar : urlbar-global.png This is the default status of the selector, it simply says that the current firefox behavior is "as before", using the same global session for all tabs.
Let’s look it when we enable session per tab on different profiles : urlbar-gmail.png urlbar-facebook.png urlbar-witter.png

When you start the browser, open a bookmark, do a search or enter manually an URL, your request is loaded with the default global session (ie "as before"). But when you select a profile with this selector, the current tab is reloaded in order to use one specific totally independant session. Futhermore, if this website open a new tab or window, or if you click on a link, the new tab, window or webpage is going to use the same specific session.


But let’s see how to use this feature from the beginning.

  1. perso-add.png default-menu.png First, we create one session linked to a personnal account. In this example I take gmail, but it can be any website : twitter, facebook, flickr, … whatever! To do so we click on the profile selector and get menu on the left and we click on "+ new profiles" and get the right’s one.
  2. We are redirected to the homepage URL, where we must sign-in for this personnal account: poirot.alex. perso-signin.png
    And we are now signed in for this "Personnal gmail" session : private-signed.png
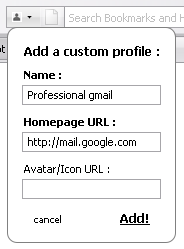
  3. add-pro.png Then, we do the same for one professional account: yoono.test.
    header-pro-signin.png
    header-pro-signed.png
  4. home-private.png Later, we can reopen one of these sessions directly to the homepage with the profile selector and get automatically signed in. The "switch to" link doesn’t go to the homepage and only reload the current tab with the selected session (very usefull for Facebook connect, sharing, …). private-signed.png

So we can open as many different account in multiple tabs or windows!


Important note:

The current version of Yoono7 doesn’t allow custom profile creation. The only profiles you can use is the ones automatically created for each account registered in the yoono’s sidebar. But watch for the next minor releases of Yoono7, we are going to ship all this very soon!


Another demo of this feature in video:

Mozilla Memory Profiling, Part 2: A Working Tool

Here is another part of my work on memory analysis in Mozilla :

another-profiler_techno-barje.fr.xpi


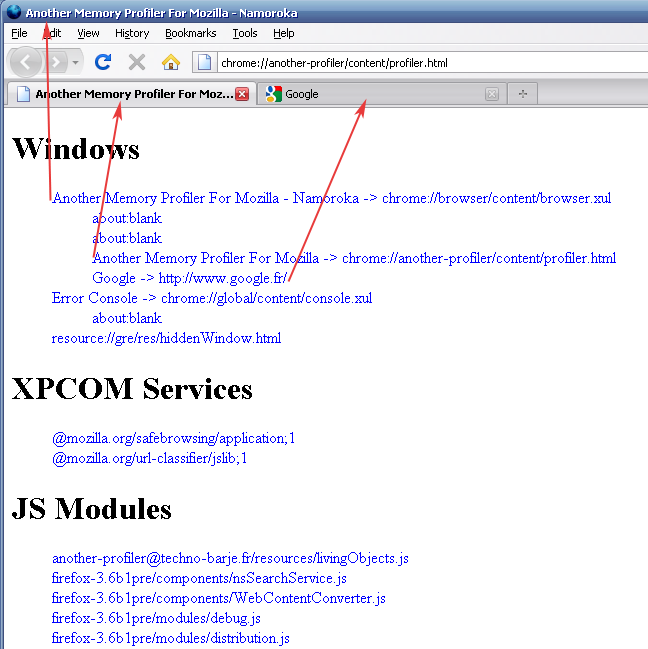
This new version of "Another memory profiler" is now an effective tool, which display a lot of information about all objects living in your Firefox instance! By all I mean not only website javascript objects, but all objects used by Firefox in its windows, sidebars, extensions, all tabs, iframes, etc. The previous version allowed you only to select one component : a DOM window(website, sub-iframe or any XUL window), a XPCOM service or a JS Module :


another-components-list.png

Component selection

Now you can get a report about currently living objects : the ones that are still used because there is at least one reference to each of them. This report first display all javascript files involved in your component :


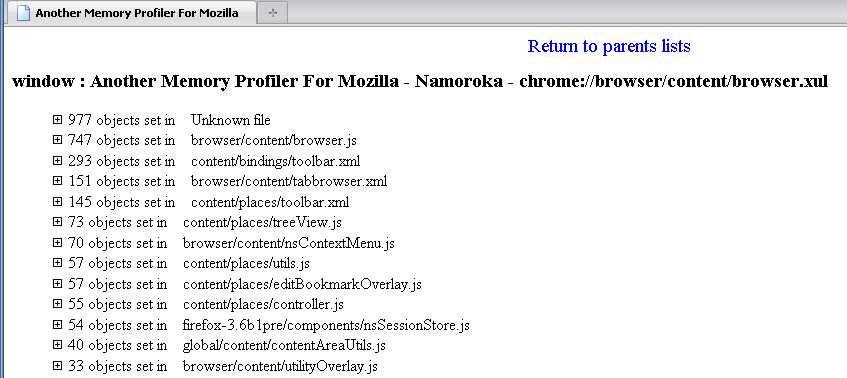
another-lines-browser.png

File selection

By selecting one file, you are seeing the number of living object sorted by there instantiation line :


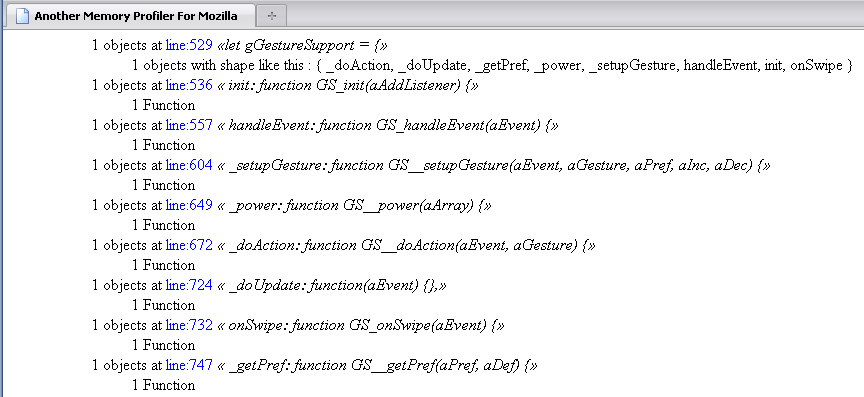
another-objects-browser.png

Living objects information

Finally, this tool display objects counts for each line sorted by there type. But Javascript is not a strongly typed language, so it’s not really easy to sort its objects by a type! That’s why there are several way to describe a JS object :

  • Define a JS object by its attributes, like Atul Varma is doing in its current work,
  • By its JS Prototype name, very usefull "typing" when you are using Prototype and build Object-Oriented JS,
  • We are facing some specialized objects like all DOM objects : HTMLFormElement, HTMLDivElement, …
  • And finally all native types, like Array, String, Date, RegExp, … etc.


Finally, let’s see how to make this extension work :

  • First It contains a binary component which is only built for Firefox 3.5 and 3.6 for Windows and Linux-32.
  • Secondly The memory profiling component is a patched version of the Mozilla Jetpack’s one, so take care to disable Jetpack, before testing this!
  • Then In order to get the maximum information about your living JS object, I strongly encourage you to set these two prefs to false :
    javascript.options.jit.content = false
    javascript.options.jit.chrome = false
    
    (That’s because Tracemonkey optimise loops and seems to embed empty stack frame information on these loop’s execution …)
  • That being said, you just have to install this extension another-profiler_techno-barje.fr.xpi, go to your Tools menu and click on "Open another memory profiler".


Come back for the next post for some more explanation on displayed results with simple scripts examples.

Firefox Everywhere

After Yoono Desktop Portable, here is Firefox Everywhere : a customized Firefox package which can be executed on any OS : Windows, Linux, MacOS and with a shared profile directory allowing you to travel with all your Firefox data on a usb stick!

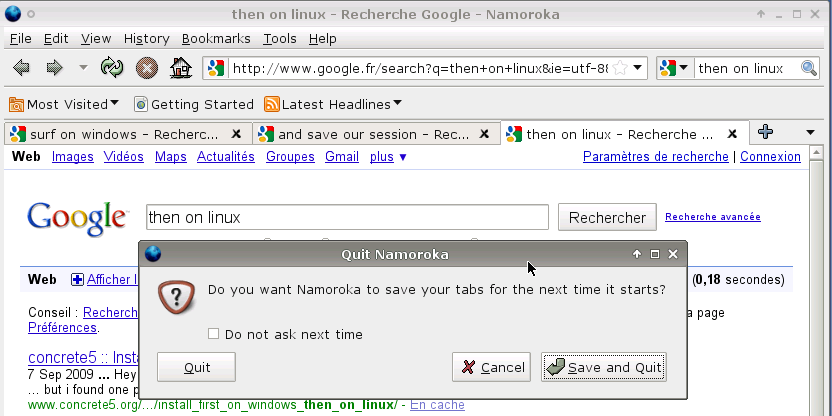
Check out this surf session starting on Windows, firefox-portable-win.png Then on Linux, firefox-portable-linux.png And finally on a Mac! firefox-portable-mac.png

FirefoxEverywhere

Download:

Tips:

  • Don’t forget to properly disconnect your usb stick, or your profile may explode!
  • This version is based on Firefox 3.6 branch in order to gain startup performance improvements of this incoming version! So don’t be afraid to have a browser named Namoroka instead of Firefox.
  • On Windows, execute: launch-windows.exe
  • On MacOS, launch-macos.command
  • On Linux, either launch-linux-64.sh or launch-linux.sh(for 32bits)

Mozilla Memory Profiling

As a Mozilla hacker, extension developer and Javascript expert, I’ve been really exited to see the current work of Atul Varma on memory profiling in Firefox! It’s naturally the next step of tool to build after XUL Profiler, which track CPU consumption and Javascript functions calls.
So, instead of waiting for web developers to describe their future new "memory" firebug tab :), I’ve searched what information we can retrieve from JS API. And I’ve not limited my scope to web content but I take all Browser objects into account.


First I’ve tried to find a meaningful parent for every living object.
In the Mozilla planet we may face with three main types of parents :

  • window : chrome (browser.xul, popups, jsconsole, sidebars, …) or content (websites,popups,iframes)
  • xpcom services
  • JS modules

(But there is also XBL, sandboxes and some others strange things like "Block")


Here is the first result of this work :

another-profiler_techno-barje.fr-1.0.xpi

This extension need Jetpack 0.6+. It adds a "Open another memory profiler" item in Tools menu and display all living windows, xpcoms and modules. Then when you select one of them, it displays the simplest profiling ever: number of js objects group by C++ native class. I’ll show you in the next blog post how to display a better profiling!
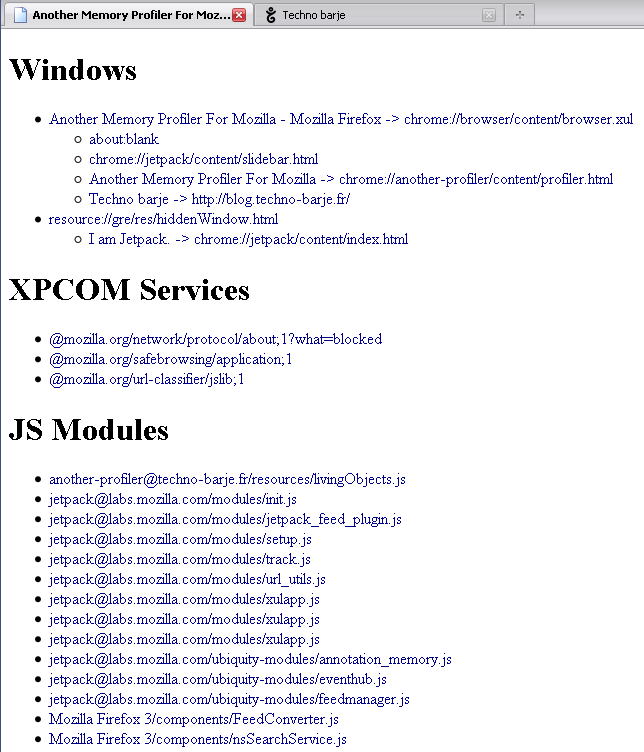
another-profiler-1.0.png But for now, I’m going to show you all the code needed to make this first version.


For the living windows, there is a lot of cases, but it’s simple :

// Get the list of absolutery ALL windows living in a Firefox session, stored as a Tree
function getAllWindows() {
  var windows = [];
  
  // Begin by iterating over all top chrome windows (browser, jsconsole, dominspector, etc.)
  var wm = Components.classes["@mozilla.org/appshell/window-mediator;1"]
          .getService(Components.interfaces.nsIWindowMediator);
  var enumerator = wm.getXULWindowEnumerator(null);
  while(enumerator.hasMoreElements()) {
    var win = enumerator.getNext();
    if (win instanceof Components.interfaces.nsIXULWindow) {
      // Search for all children windows (sidebar, content, iframes, ...)
      parseDocshell(win.docShell);
   }
  }

  function getWindowByDocShell(docShell) {
    if (!(docShell instanceof Components.interfaces.nsIInterfaceRequestor))
      return;
    return docShell.getInterface(Components.interfaces.nsIDOMWindow);
  }
  function parseDocshell(docShell) {
    if (!docShell) return;
    var domWindow = getWindowByDocShell(docShell);
    
    var topWindow = {
          type  : "window",
          name  : domWindow.document.title,
          href  : domWindow.location.href,
          object: domWindow,
          children: []
        };
    windows.push(topWindow);
    
    var topWindows = [topWindow];
    
    var treeItemType = Components.interfaces.nsIDocShellTreeItem.typeAll;
    // From inspector@mozilla.org inspector.js appendContainedDocuments
    // Load all the window's content docShells
    var containedDocShells = docShell.getDocShellEnumerator(treeItemType,
                                      Components.interfaces.nsIDocShell.ENUMERATE_FORWARDS);
    while (containedDocShells.hasMoreElements())
    {
      var childShell = containedDocShells.getNext().QueryInterface(Components.interfaces.nsIDocShell);
      
      if (childShell == docShell) {
        // It's the current topWindow
        continue;
      }
      
      var childDOMWindow = getWindowByDocShell(childShell);
      if (!childDOMWindow) continue;
      var parent;
      for(var i=0; i<topWindows.length; i++) {
        if (topWindows[i].object == childDOMWindow.parent) {
          parent = topWindows[i];
          break;
        }
      }
      var newWindow = {
        type  : "window",
        name  : childDOMWindow.document.title,
        href  : childDOMWindow.location.href,
        object: childDOMWindow,
        children : []
      };
      topWindows.push(newWindow);
      if (parent)
        parent.children.push(newWindow);
      else
        topWindow.children.push(newWindow);
    }
    delete topWindows;
  }
  
  // Finally, don't forget *the* hidden window, it's a big one used by many extensions!
  var hiddenWindow = Components.classes["@mozilla.org/appshell/appShellService;1"]
         .getService(Components.interfaces.nsIAppShellService)
         .hiddenWindow;
  if (hiddenWindow instanceof Components.interfaces.nsIXULWindow) {
    parseDocshell(hiddenWindow.docShell);
  }
  
  return windows;
}


For XPCOM services, it’s shorter, but it’ an unknown practice :

// Get the list of all XPCOM services (not the xpcom objects, only services) in a Firefox session
function getAllXPCOMServices() {
  var instanciatedServices = [];
  var serviceManager=Components.manager.QueryInterface(Components.interfaces.nsIServiceManager);
  var supports = Components.interfaces.nsISupports;
  for(var cl in Components.classes) {
    try {
      if (serviceManager.isServiceInstantiated(Components.classes[cl],supports)) {
        var service=Components.classes[cl].getService(supports);
        if (service.wrappedJSObject) {
          // Get the global object
          service=service.wrappedJSObject.__parent__;
          if (!service)
            service=Components.classes[cl].getService(supports).__parent__;
          instanciatedServices.push({
            type   : "xpcom",
            name   : cl,
            object : service
          });
        }
      }
    } catch(e) {
      // serviceManager.isServiceInstantiated is throwing if there is no instance ...
    }
  }
  return instanciatedServices;
}


But for JS Modules, I’ve not found any way to get those …
The only solution I’ve got was to do a quick profiling and identify them :

function searchJSModules () {
  var jsmodules = [];
  
  var roots=getGCRoots();
  for(var r in roots) {
    var id = roots[r];
    var info = getObjectInfo(id);
    var properties = getObjectProperties(id);
    /*
    // We can also identify XPCOM by reading global NSGetModule function
    var nsgetmodule = getObjectProperty(id,"NSGetModule").NSGetModule;
    if (nsgetmodule) {
      print (" --> is an XPCOM");
      print (" --> defined in : "+getObjectInfo(nsgetmodule).filename);
      continue;
    }
    */
    // See if the current object has a EXPORTED_SYMBOLS object
    // We suppose every JS Module has one ...
    var exportedsymbols = getObjectProperty(id,"EXPORTED_SYMBOLS").EXPORTED_SYMBOLS;
    if (!exportedsymbols) continue;
    
    // Then search for the first declared function
    // Which will allow us to get the file of this module!
    
    // Begin to search in EXPORTED_SYMBOLS
    var symbols = getObjectProperties(exportedsymbols);
    var filename;
    for(var i in symbols) {
      var s = getObjectProperty(id,symbols[i])[symbols[i]];
      var inf = getObjectInfo(s);
      if (!inf) continue;
      if (inf.nativeClass=="Function" && inf.filename) {
        filename=inf.filename;
        break;
      } else if (inf.nativeClass="Object") {
        var subprops = getObjectProperties(s);
        for(var j in subprops) {
          var subs = subprops[j];
          var subinf = getObjectInfo(subs);
          if (!subinf) continue;
          if (subinf.nativeClass=="Function" && subinf.filename) {
            filename = subinf.filename;
            break;
          }
        }
        if (filename) break;
      }
    }
    if (!filename) {
      // Unable to found a function in exported_symbols objects
      // now try to find a function defined in global context
      var table = getObjectTable();
      var count=0;
      for (var subid in table) {
        var subinf = getObjectInfo(parseInt(subid));
        if (subinf && subinf.parent == id && subinf.nativeClass=="Function" && subinf.filename) {
          filename = subinf.filename;
          break;
        }
      }
    }
    if (filename) {
      var file = filename;
      var res = filename.match(/\/([^\/]+\/[^\/]+\/[^\/]+\.\w+)$/);
      if (res)
        file = decodeURIComponent(res[1]);
      jsmodules.push({
        type  : "jsmodule",
        name  : file,
        file  : filename,
        object: id
      });
    } else {
      // we were unable to find any function, we may try to search deeper
    }
  }
  
  return JSON.stringify(jsmodules);
}

function getAllJSModules() {
  var factory = Components.classes["@labs.mozilla.com/jetpackdi;1"]
               .createInstance(Components.interfaces.nsIJetpack);
  var endpoint = factory.get();
  var json = endpoint.profileMemory(searchJSModules.toSource()+"
searchJSModules()", "find-jsmodules.js", 1, null);
  return JSON.parse(json);
}


Finally, here is the function which retrieve objects counts for one parent. It use the Jetpack memory profiler XPCOM.

function profileFunction() {
  var namedObjects=getNamedObjects();
  
  // namedObjects["parent"] is null ... why ?!
  var parent;
  for(var i in namedObjects) {
    if (i=="parent") {
      parent = parseInt(namedObjects[i]);
    }
  }
  
  // Remove web content windows js wrapper
  var inf = getObjectInfo(parent);
  if (inf && inf.nativeClass=="XPCSafeJSObjectWrapper") {
    parent = inf.wrappedObject;
  }
  
  var children = {};
  
  // Check every JS object
  var table = getObjectTable();
  for(var i in table) {
    var info = getObjectInfo(parseInt(i));
    
    // Search if this one is related to the selected parent
    // ie walk throught all parents in order to find if the current object is a descendant of selected parent
    if ( info.parent != parent ) {
      var parentMatch = false;
      var p = info.parent;
      while(true) {
        var subinfo = getObjectInfo(p);
        if (!subinfo) break;
        
        if ( subinfo.id == parent || subinfo.parent == parent ) {
          // Answer= Yes
          parentMatch = true;
          break;
        }
        
        // Walk throught encapsulated objects
        if (subinfo.outerObject && subinfo.outerObject!=p) {
          p = subinfo.outerObject;
          continue;
        }
        
        p = subinfo.parent;
      }
      // Answer= Yes
      if (!parentMatch) continue;
    }
    
    if (!children[info.nativeClass])
      children[info.nativeClass] = 0;
    children[info.nativeClass]++;
  }
  
  return JSON.stringify(children);
}
function profileParent(parent) {
  var factory = Components.classes["@labs.mozilla.com/jetpackdi;1"]
               .createInstance(Components.interfaces.nsIJetpack);
  var endpoint = factory.get();
  var json = endpoint.profileMemory(profileFunction.toSource()+"
profileFunction()", "profile.js", 1, {parent: parent});
  return JSON.parse(json);
}

More information


Come back for the next blog post to get the 2.0 version :)
Hackability Test : Google Chrome vs Mozilla Firefox (With Jetpack)

Here is a small summary of what we are able to extend in Chrome and Firefox(with Jetpack).


How to add a new item in context menu (right click menu)

In Chrome

You just can’t, see here.

In Firefox, with Jetpack

jetpack.future.import("menu");
jetpack.future.import("selection");

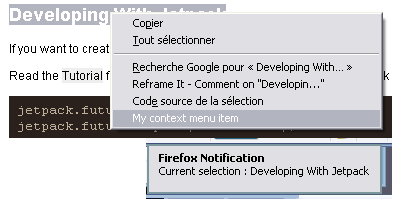
jetpack.menu.context.page.add(function(context)({
   label: "My context menu item",
   command: function(target) {
     
     // Do something fun with this selection
     jetpack.notifications.show( "Current selection : "+jetpack.selection.text );
     
   }
 }));

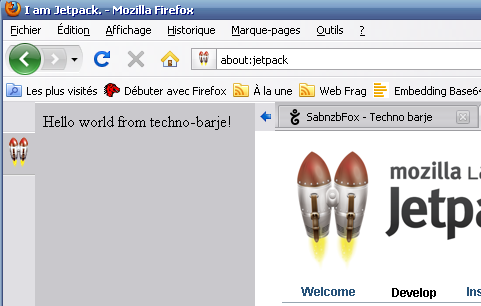
jetpack-context.png A lot more information here


How to add a sidebar ?

In Chrome

You just can’t, it’s a well known limitation, but nobody say it loud.

In Firefox, with Jetpack

jetpack.future.import("slideBar");
jetpack.slideBar.append({
   url: "about:blank",
   width: 220,
   persist: true,
   autoReload: false,
   onReady: function(slide){

     // Do something fun with this sidebar
     var doc = slide.contentDocument;
     doc.body.innerHTML="Hello world from techno-barje!"

   }
 });

jetpack-slidebar.png More details here


How to have settings and display them to users ?

In Chrome

You have to add custom menu somewhere, as you want. So each extension may display a different way to fill up their settings …

In Firefox, with Jetpack

var manifest = {
  settings: [
    {
      name: "twitter",
      type: "group",
      label: "Twitter",
      settings: [
        { name: "username", type: "text", label: "Username" },
        { name: "password", type: "password", label: "Password" }
      ]
    },
    {
      name: "facebook",
      type: "group",
      label: "Facebook",
      settings: [
        { name: "username", type: "text", label: "Username", default: "jdoe" },
        { name: "password", type: "password", label: "Secret" }
      ]
    },
    { name: "music", type: "boolean", label: "Music", default: true },
    { name: "volume", type: "range", label: "Volume", min: 0, max: 10, default: 5 },
    { name: "size", type: "number", label: "Size" },
    { name: "mood", type: "member", label: "Mood", set: ["happy", "sad", "nonchalant"] }
  ]
};

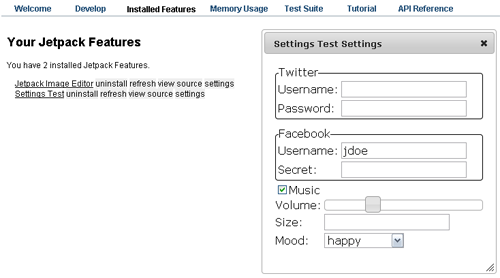
jetpack-settings.png Full planned API(work in progress)
You can track progress here
Jetpack demo here


How to display a system notification (or something like) ?

In Chrome

You may display a custom HTML popup, but you will have to handle youself display/hide of this popup, his style and each extension will have his notification system …

In Firefox, with Jetpack

jetpack.notifications.show({title: 'hai2u', body: 'o hai.', icon: 'http://www.mozilla.org/favicon.ico'}); 

jetpack-notifications.png More info here


Yoono Desktop Portable

Here is a new Yoono feature that really need some emphasis!

Yoono Desktop Portable

This new version allows you to launch the Yoono’s social network aggregation tool directly from a usb key. And the most important point is that your profile is saved on it, so no personal data is saved in the computer you’re using and all your settings and socials updates travel with you.
The icing on the cake is that it’s even more "portable" than just that! You can even launch this application on Windows AND MacOS!!!

Only two steps to test this :

  • Unzip yoono-desktop-portable.zip somewhere on a usbkey
  • On windows, launch "Yoono Desktop Portable.exe"
  • On macos, launch "Yoono Desktop Portable"

YoonoDesktopShort.png

The only drawback is usb drive read/write performance. Depending on drive model Yoono Desktop appears to take long time to load. But we are going to gain a huge speed up with current work on mozilla platform about startup performance. So don’t forget to check out yoono desktop portable when Firefox 3.6 is out! (release planned before the end of the year)

SabnzbFox

Now, a real world usage of my previous JS Module.


SabnzbdFox


SabnzbdFox features

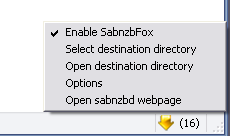
  • Catch absolutely all NZB file requests
  • Automatically save all these files to a specific directory (not limited to sabnzbd usage!)
  • Or Automatically upload to sabnzbd server via its web-API
  • Display current downloads count

SabnzbdFox prerequisites

  • Firefox
  • Sabnzbd or any newsreader which automatically read nzb files in a directory.

install SabnzbdFox on addons.mozilla.org

sabnzbdfox

Ocaml Native Code Debugging

Note: english translation of my previous post

t-caml-valid-callgraph.png

Now that Improve gnu ELF bug is commited in ocaml 3.11+, KCachegrind can generate beautifull callgraphs.

This patch consist in adding .size instructions (in ELF assembly code) in order to allow valgrind to interpret all symbols (camlT_entry, camlT_foo, camlT_bar, ..) and it can so display symbols names instead of their hexadecimal numbers!!!

ELF instructions for debug

Now, we may want these tools to be able to display file name and line number for all functions.(File name is present in symbols name but it doesn’t allow full usage of these tools)

Let’s see how’s gcc working :

  int bar(int a) {
        return 1+a;
  }
  
  int foo(int a) {
        return 2+bar(a);
  }
  
  int main() {
        foo(3);
  }
  $ gcc -O0 -g -S t.c
  .globl bar
        .type   bar, @function
  bar:
  .LFB2:
        .file 1 "t.c"
        .loc 1 1 0
        pushq   %rbp
  .LCFI0:
        movq    %rsp, %rbp
  .LCFI1:
        movl    %edi, -4(%rbp)
        .loc 1 2 0
        movl    -4(%rbp), %eax
        incl    %eax
        .loc 1 3 0
        leave
        ret
  .LFE2:
        .size   bar, .-bar
  .globl foo
        .type   foo, @function

Usefull instructions are .file and .loc :

  • .file define a file path and bind it to an id

-> .file $file_id"$file_path"

  • .loc define a file, a line and column number to the next instructions

-> .loc $file_id$ $line$ $column$

Suggested solution

The compiler module which emits these instructions is : asmcomp/i386/emit.mlp
And especially this "fundecl" function :

  let fundecl fundecl =
    function_name := fundecl.fun_name;
    fastcode_flag := fundecl.fun_fast;
    (* ... *)
    `   .globl  {emit_symbol fundecl.fun_name}
`;
    `{emit_symbol fundecl.fun_name}:
`;
    if !Clflags.gprofile then emit_profile();
    let n = frame_size() - 4 in
    if n > 0 then
      ` subl    ${emit_int n}, %esp
`;
    `{emit_label !tailrec_entry_point}:
`;
    emit_all true fundecl.fun_body;
    List.iter emit_call_gc !call_gc_sites;
    emit_call_bound_errors ();
    List.iter emit_float_constant !float_constants;
    match Config.system with
      "linux_elf" | "bsd_elf" | "gnu" ->
        `       .type   {emit_symbol fundecl.fun_name},@function
`;
        `       .size   {emit_symbol fundecl.fun_name},.-{emit_symbol fundecl.fun_name}
`
    | _ -> ()

Except that the only data we have is the fundecl variable :

  type fundecl = 
  { fun_name: string;
    fun_body: instruction;
    fun_fast: bool } 
  type instruction =
  { mutable desc: instruction_desc;
    mutable next: instruction;
    arg: Reg.t array;
    res: Reg.t array;
    dbg: Debuginfo.t;
    live: Reg.Set.t }

There is a dbg attribute on instructions but it’s rarely set. (One compilation with -dlinear option allow to see this fact)

I’ve decided to add a fun_dbg : Debuginfo.t attribute on "fundecl" type and fill it in all compilation steps. It may more clever to work on this (often-empty) "dbg" attribute ? (it would allow to add position information on all instructions, it can be usefull for valgrind and gdb) This patch is not optimised because it repeats .file instruction for each .loc and so it repeats it on each function header.

-> Patch based on release311 branch, but works on current trunk

Now let’s see what brings this patch

gdb results

  $ ocamlopt -g -inline 0 t.ml
  $ gdb a.out
  (gdb) break t.ml:6
  Breakpoint 1 at 0x8049940: file t.ml, line 6.
  (gdb) run
  Starting program: /home/alex/callgraph/a.out 
  
  Breakpoint 1, camlT__foo_60 () at t.ml:6
  6       let foo i  =
  Current language:  auto; currently asm

  (gdb) backtrace
  #0  camlT__foo_60 () at t.ml:7
  #1  0x0804c570 in camlT__entry () at t.ml:12
  #2  0x0806e4b7 in caml_start_program ()
  
  (gdb) step 1
  camlT__bar_58 () at t.ml:2
  2       let bar i =
  
  (gdb) list
  1
  2       let bar i =
  3               1+i
  4       ;;
  5
  6       let foo i  =
  7               2+(bar i )
  8       ;;
  9
  10      let () =

gprof results

  $ ocamlopt -g -p -inline 0 t.ml
  $ ./a.out
  $ gprof -A
  *** File /home/alex/callgraph/t.ml:
                  
           1 -> let bar i =
                        Thread.delay 3.0;
                        1+i
                ;;
                
           1 -> let foo i  =
                        2+(bar i )
                ;;
                
                let () =
           1 ->         let closure() = 3 in
                        print_int ( foo (closure()) )
                ;;
                
  Top 10 Lines:

     Line      Count
        2          1
        7          1
       12          1

  Execution Summary:

        3   Executable lines in this file
        3   Lines executed
   100.00   Percent of the file executed

        3   Total number of line executions
     1.00   Average executions per line

valgrind/kcachegrind results

  $ ocamlopt -g -inline 0 t.ml
  $ valgrind --tool=callgrind ./a.out
  $ callgrind_annotate callgrind.out.2152 t.ml
  --------------------------------------------------------------------------------
  -- User-annotated source: t.ml
  --------------------------------------------------------------------------------
  .  
  8  let bar i =
  77,715  => thread.ml:camlThread__delay_75 (1x)
  .      Thread.delay 3.0;
  .      1+i
  .  ;;
  .  
  3  let foo i  = 
  77,723  => t.ml:camlT__bar_58 (1x)
  .      2+(bar i )
  .  ;;
  .  
  .  let () =
  13          let closure() = 3 in
  1,692  => pervasives.ml:camlPervasives__output_string_215 (1x)
  2,312  => pervasives.ml:camlPervasives__string_of_int_154 (1x)
  77,726  => t.ml:camlT__foo_60 (1x)
  .      print_int ( foo (closure()) )
  .  ;;
  .  
  $ kcachegrind callgrind.out.2152

kcachegrind-file-and-line.png


And next ?

We first need to wait approval for this new feature by ocaml community, I’ve submitted it there.
I someone from INRIA read this … Don’t hesitate to contact me, I’m open to work on a different approach.
After that, we may hope a lot of new features, like :

  • breakpoints on any caml line (not only function call)
  • gdb plugin allowing to read value in a breakpoint!